


































Importing an Observability Cluster
The Platform Console can run a dedicated observability cluster that collects telemetry (metrics, logs, and traces) from your spoke clusters through OpenTelemetry. This guide covers the two import-time tasks:
- Importing the observability cluster itself.
- Enabling the OpenTelemetry feature on the spoke clusters you want to monitor.
For the full end-to-end setup — MinIO, the telemetry bucket, and the
TelemetryStack — see OpenTelemetry Monitoring.
Import the Observability Cluster
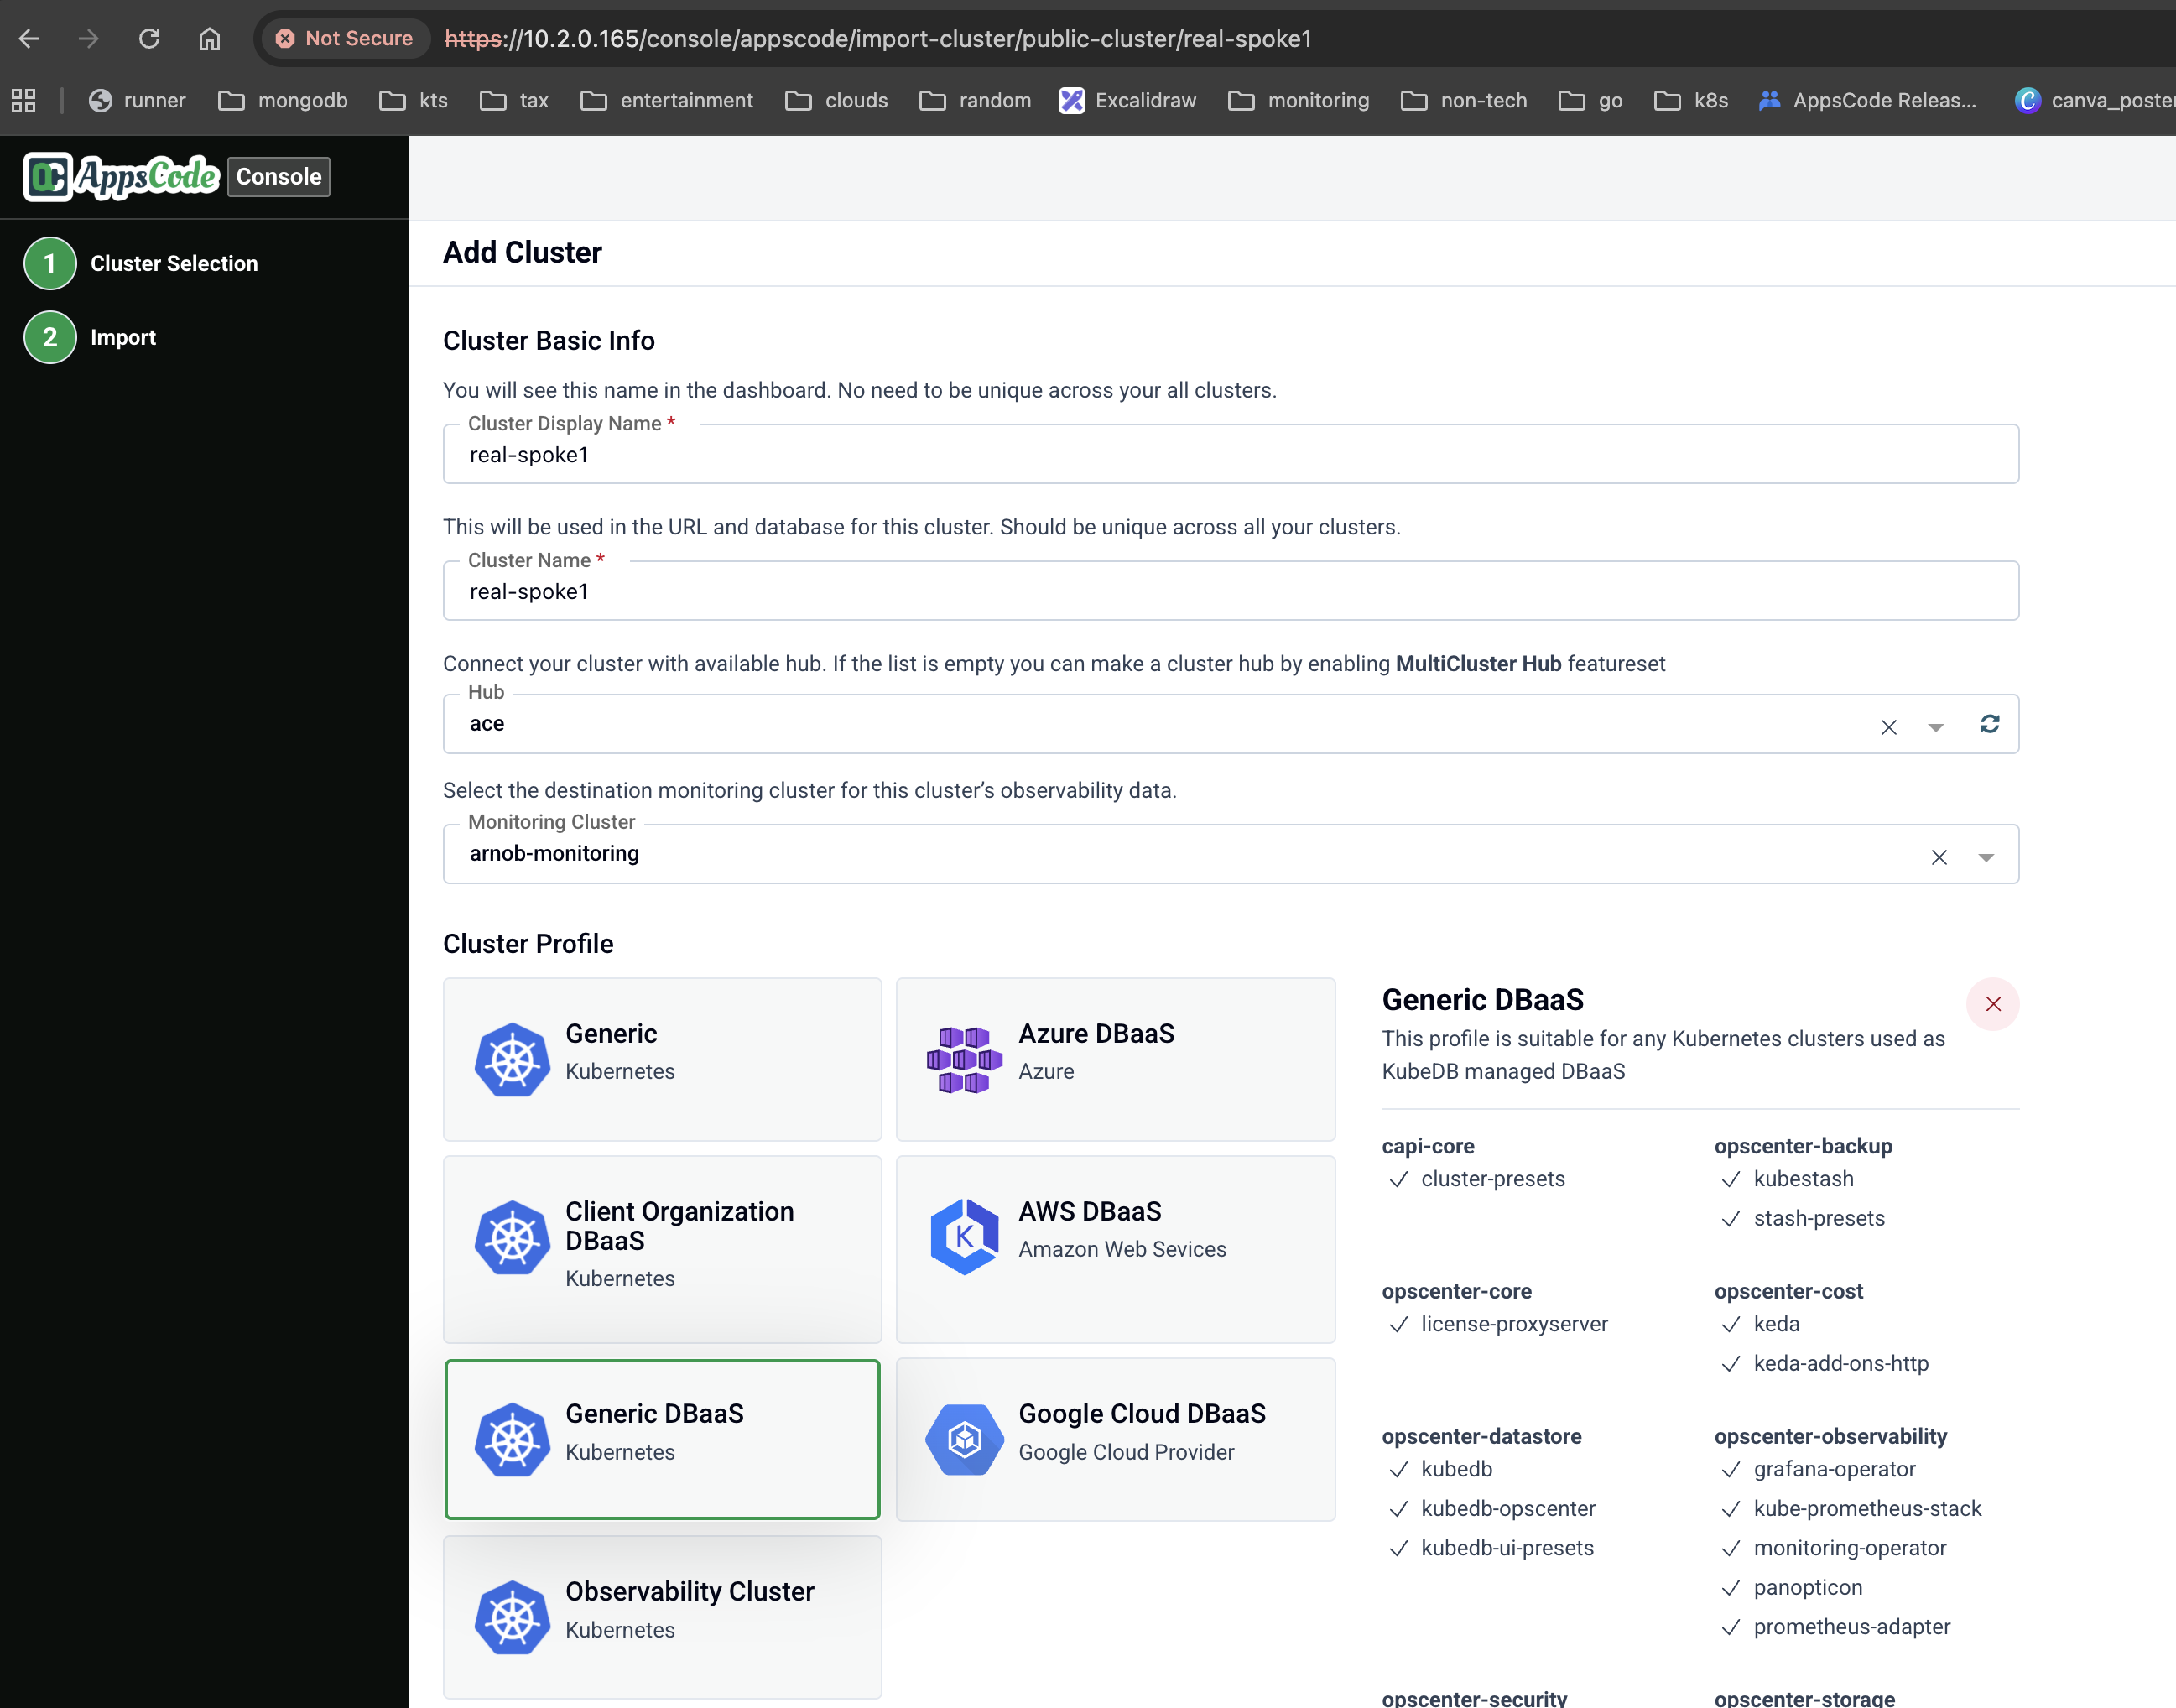
Import the cluster as a spoke as you normally would (see Adding a Cluster). During the import flow, select the Observability Cluster cluster profile. This provisions the components required to receive and store telemetry from other clusters.
Enable the OpenTelemetry Feature on a Spoke Cluster
Once the observability cluster is ready, enable the OpenTelemetry feature on each spoke cluster you want it to monitor. There are two ways to do this.
Option A: During Cluster Import
When importing a new cluster, select the destination observability cluster from the Monitoring Cluster drop-down in the import flow. This automatically enables the OpenTelemetry feature on the new spoke and routes its telemetry to the chosen monitoring cluster.
Option B: On an Existing Spoke Cluster
Import the cluster as a spoke (if it is not already imported).
Install the Perses dashboards on the cluster:
helm upgrade -i kubedb-perses-dashboards \
  oci://ghcr.io/appscode-charts/kubedb-perses-dashboards \
  -n monitoring --create-namespace \
  --version=v2026.4.27
Navigate to the cluster’s Observability feature set.
Enable the
appscode-otel-stackfeature.