































OpenTelemetry Monitoring
This guide walks through setting up an observability stack that collects telemetry from your spoke clusters using OpenTelemetry, stores it in an object-storage bucket, and exposes it through a TelemetryStack.
Architecture
The setup involves three kinds of clusters:
- Hub cluster — the central Platform Console (ACE). This is where you operate clusters, manage organizations, and view dashboards. It is the management plane; it does not store telemetry itself.
- Monitoring cluster — a dedicated observability cluster that runs the TelemetryStack and stores all telemetry: metrics (Thanos + object storage), and logs and traces (ClickHouse). It serves multi-tenant queries back to the hub. This is the cluster imported with the Observability Cluster profile.
- Spoke / imported clusters — the clusters you actually want to observe.
Once the OpenTelemetry feature (
appscode-otel-stack) is enabled on them, their collectors ship metrics, logs, and traces to the monitoring cluster.
In short: spoke clusters produce telemetry, the monitoring cluster stores and serves it, and the hub is where you view it.
The Monitoring Cluster’s Special Features
Beyond a normal spoke, the monitoring cluster runs three components (in the
monitoring namespace) that make multi-tenant telemetry storage work:
thanos-operator— reconciles the Thanos custom resources (ThanosReceive,ThanosStore,ThanosQuery,ThanosCompact,ThanosRuler) that the TelemetryStack generates into running workloads. It is the controller that turns your TelemetryStack spec into an actual Thanos deployment.tenant-operator— managesTenantcustom resources. Each client organization / monitored cluster gets aTenantthat references the TelemetryStack and defines its retention and ingest/query endpoints, giving every tenant an isolated slice of the shared stack.prom-label-proxy— the multi-tenant gateway on the ingest and query paths. It enforces per-tenant label filtering (via the tenant ID / label) so each tenant can only write to and read back its own data. TheTenantendpoints point at this proxy.
Overview
The end-to-end flow is:
- Create a self-hosted installer.
- Create the observability cluster.
- Install MinIO.
- Create the
telemetrybucket. - Create a TelemetryStack.
- Enable OpenTelemetry on the spoke clusters to be monitored.
- Create a client organization.
Step 1: Create the Self-Hosted Installer
Set up a self-hosted installer for your environment.
Step 2: Create the Observability Cluster
Create a new cluster and import it as a spoke, choosing the Observability Cluster cluster profile during import. See Import Observability Cluster for details.
Step 3: Install MinIO
The TelemetryStack can be backed by any S3-compatible object storage — MinIO is used here only as an example. Substitute your own storage solution (AWS S3, GCS, Ceph, etc.) as needed.
Install MinIO on the observability cluster to provide the object storage that backs the TelemetryStack:
kubectl create ns minio

kubectl create secret generic tls-ssl-minio -n minio \
  --from-file=private.key \
  --from-file=public.crt

kubectl create secret generic tls-ssl-minio -n monitoring \
  --from-file=private.key \
  --from-file=public.crt

helm repo add minio-comm https://charts.min.io/

helm upgrade -i minio \
  --namespace minio \
  --create-namespace \
  --set rootUser=rootuser,rootPassword=rootpass123 \
  minio-comm/minio \
  -f ./minio/minio-values.yaml
The tls-ssl-minio secret is created in both the minio and monitoring
namespaces so that MinIO and the telemetry components can serve and consume TLS
using the same certificate pair (private.key / public.crt).
Step 4: Create the telemetry Bucket
Port-forward the MinIO console and create the bucket through the UI:
kubectl port-forward -n minio svc/minio-console 9001:9001
Open https://localhost:9001 and log in:
| Field | Value |
|---|---|
| Username | rootuser |
| Password | rootpass123 |
Create a bucket named telemetry.
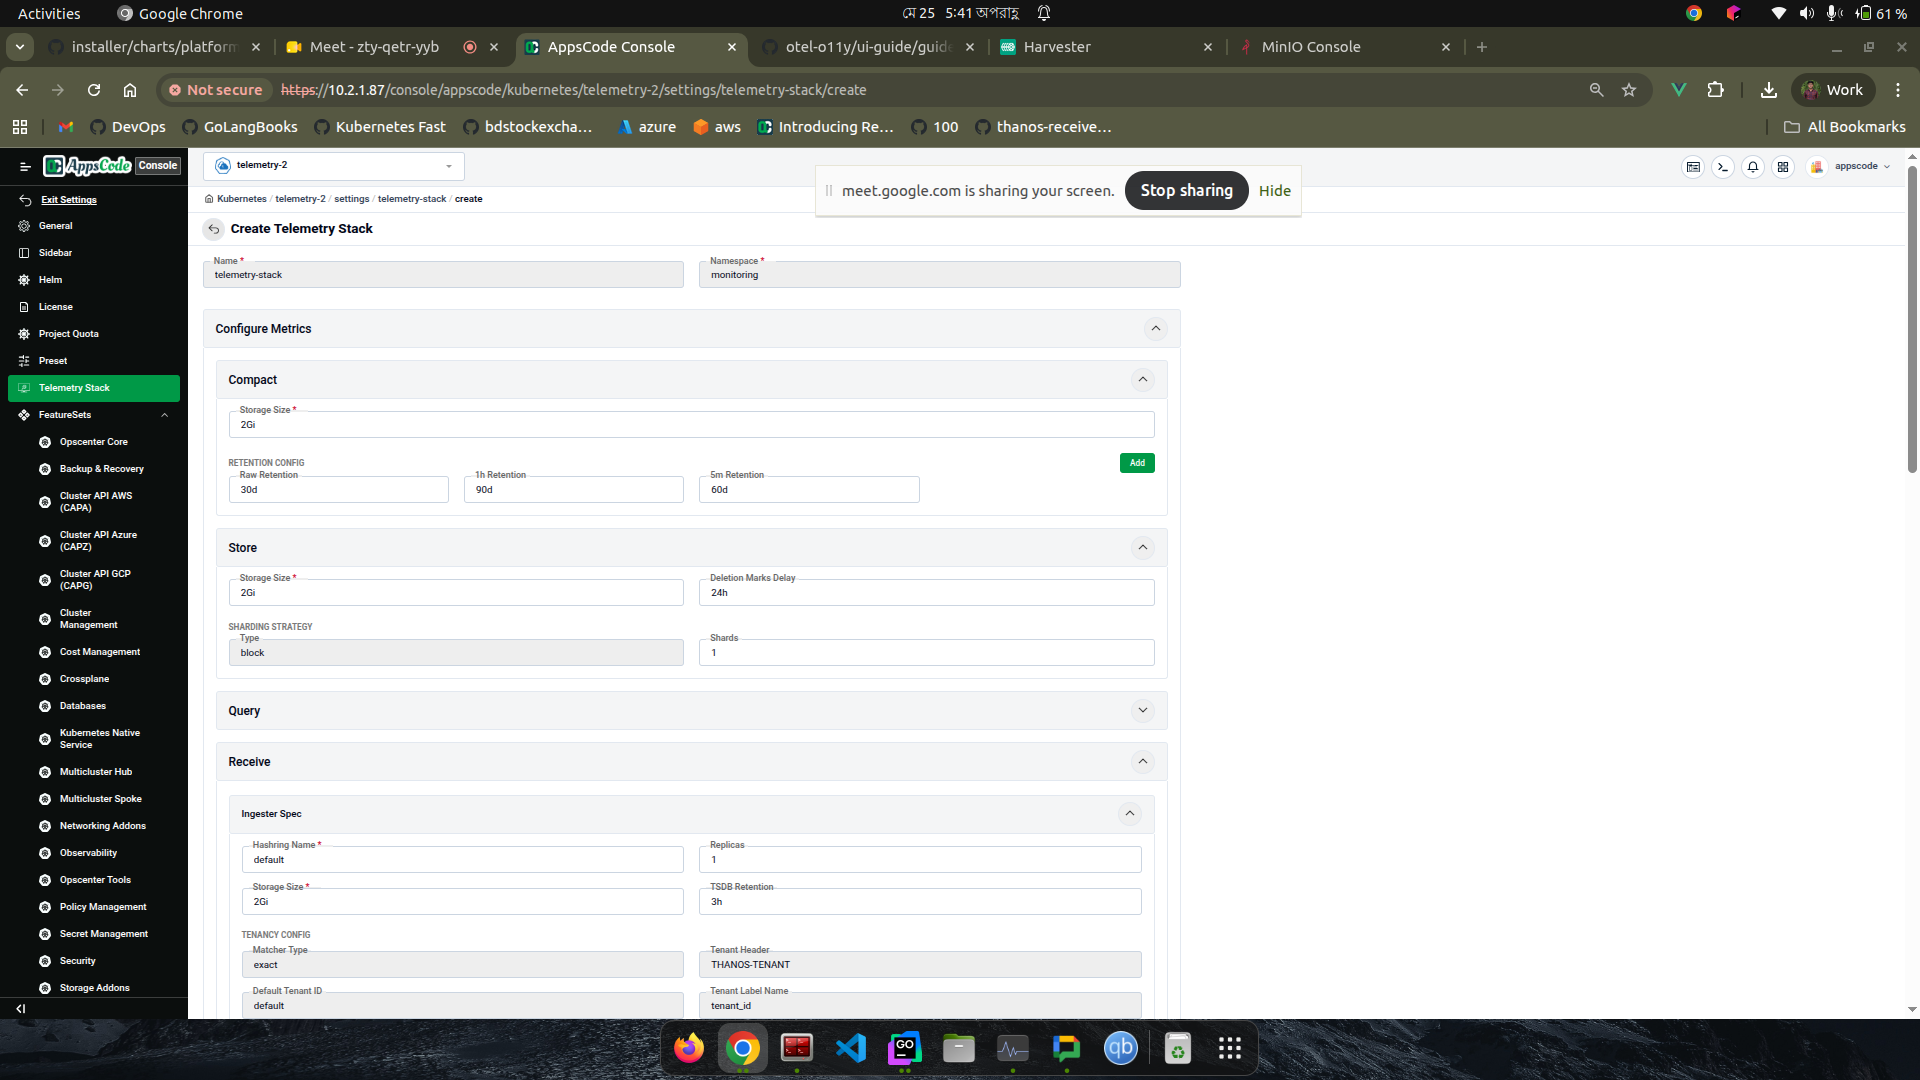
Step 5: Create a TelemetryStack
In the observability cluster, navigate to:
Settings → TelemetryStack → Create a new Telemetry stack
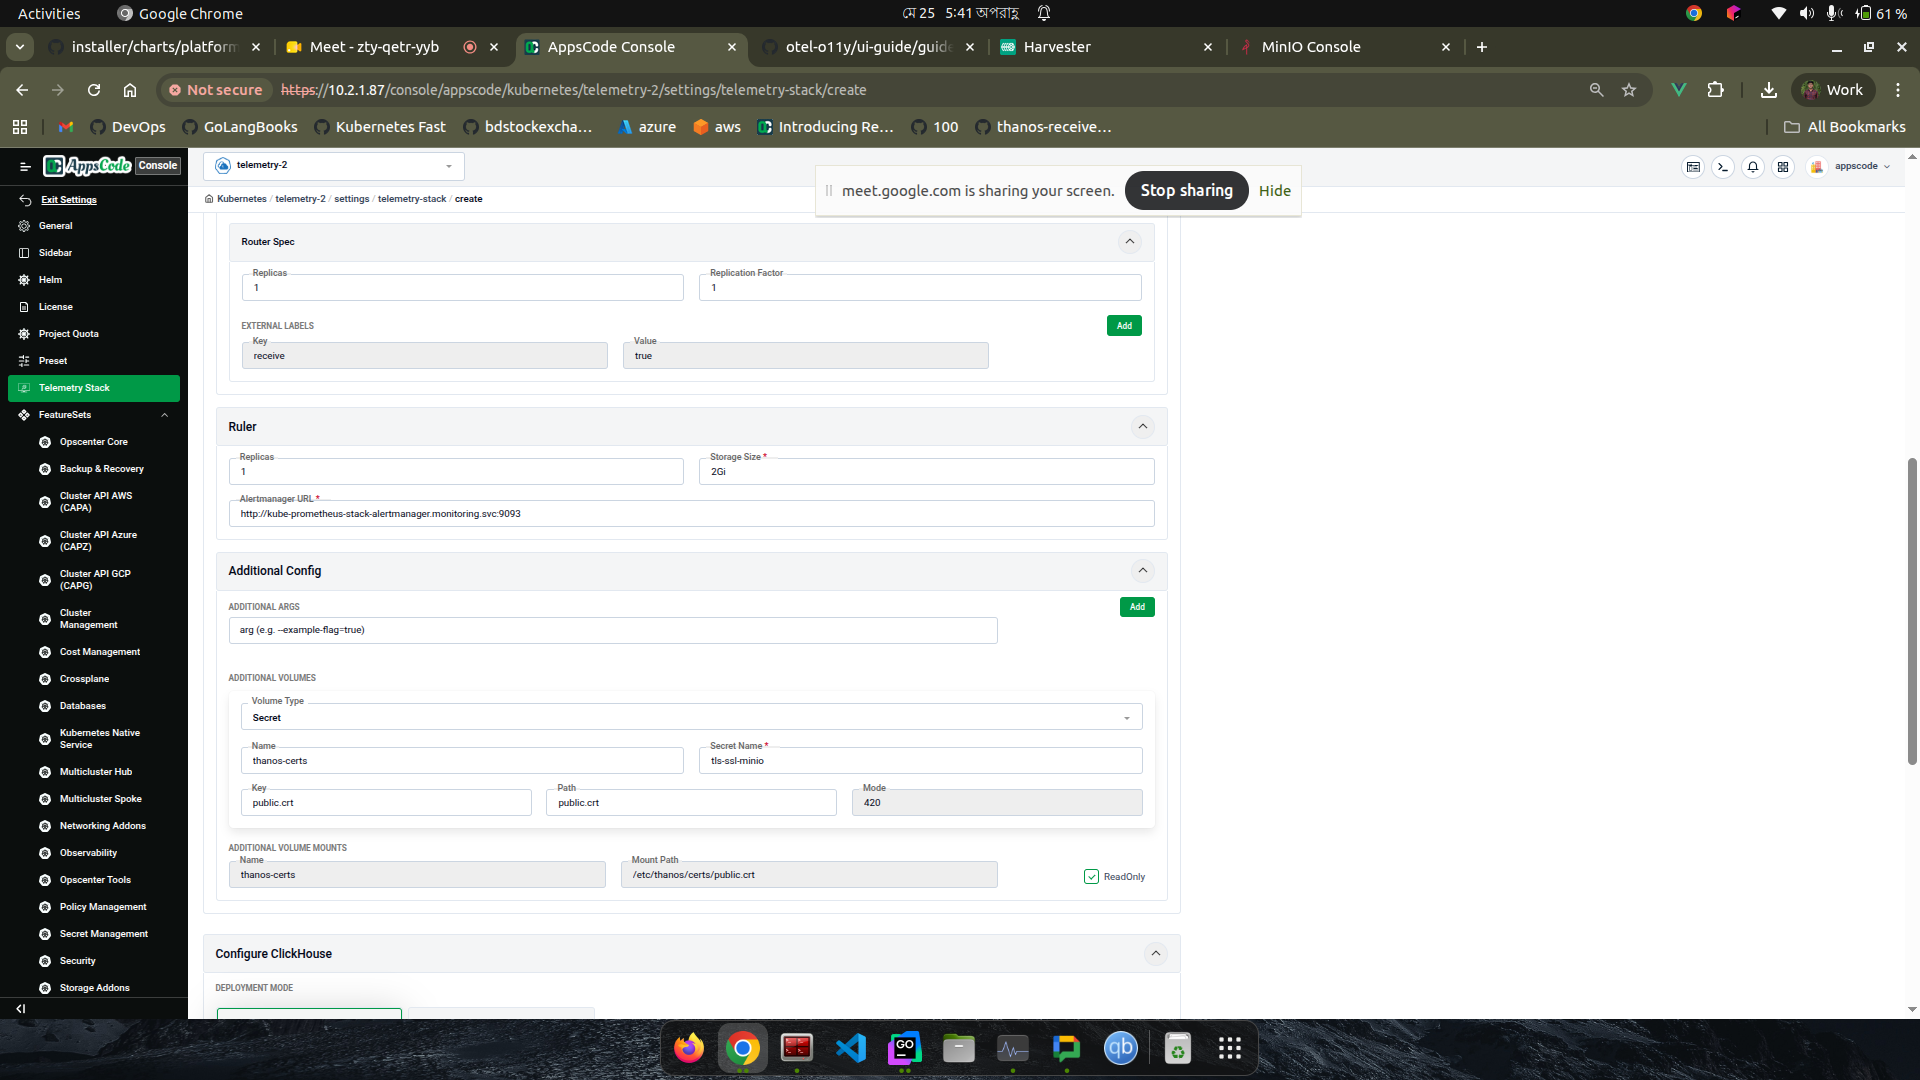
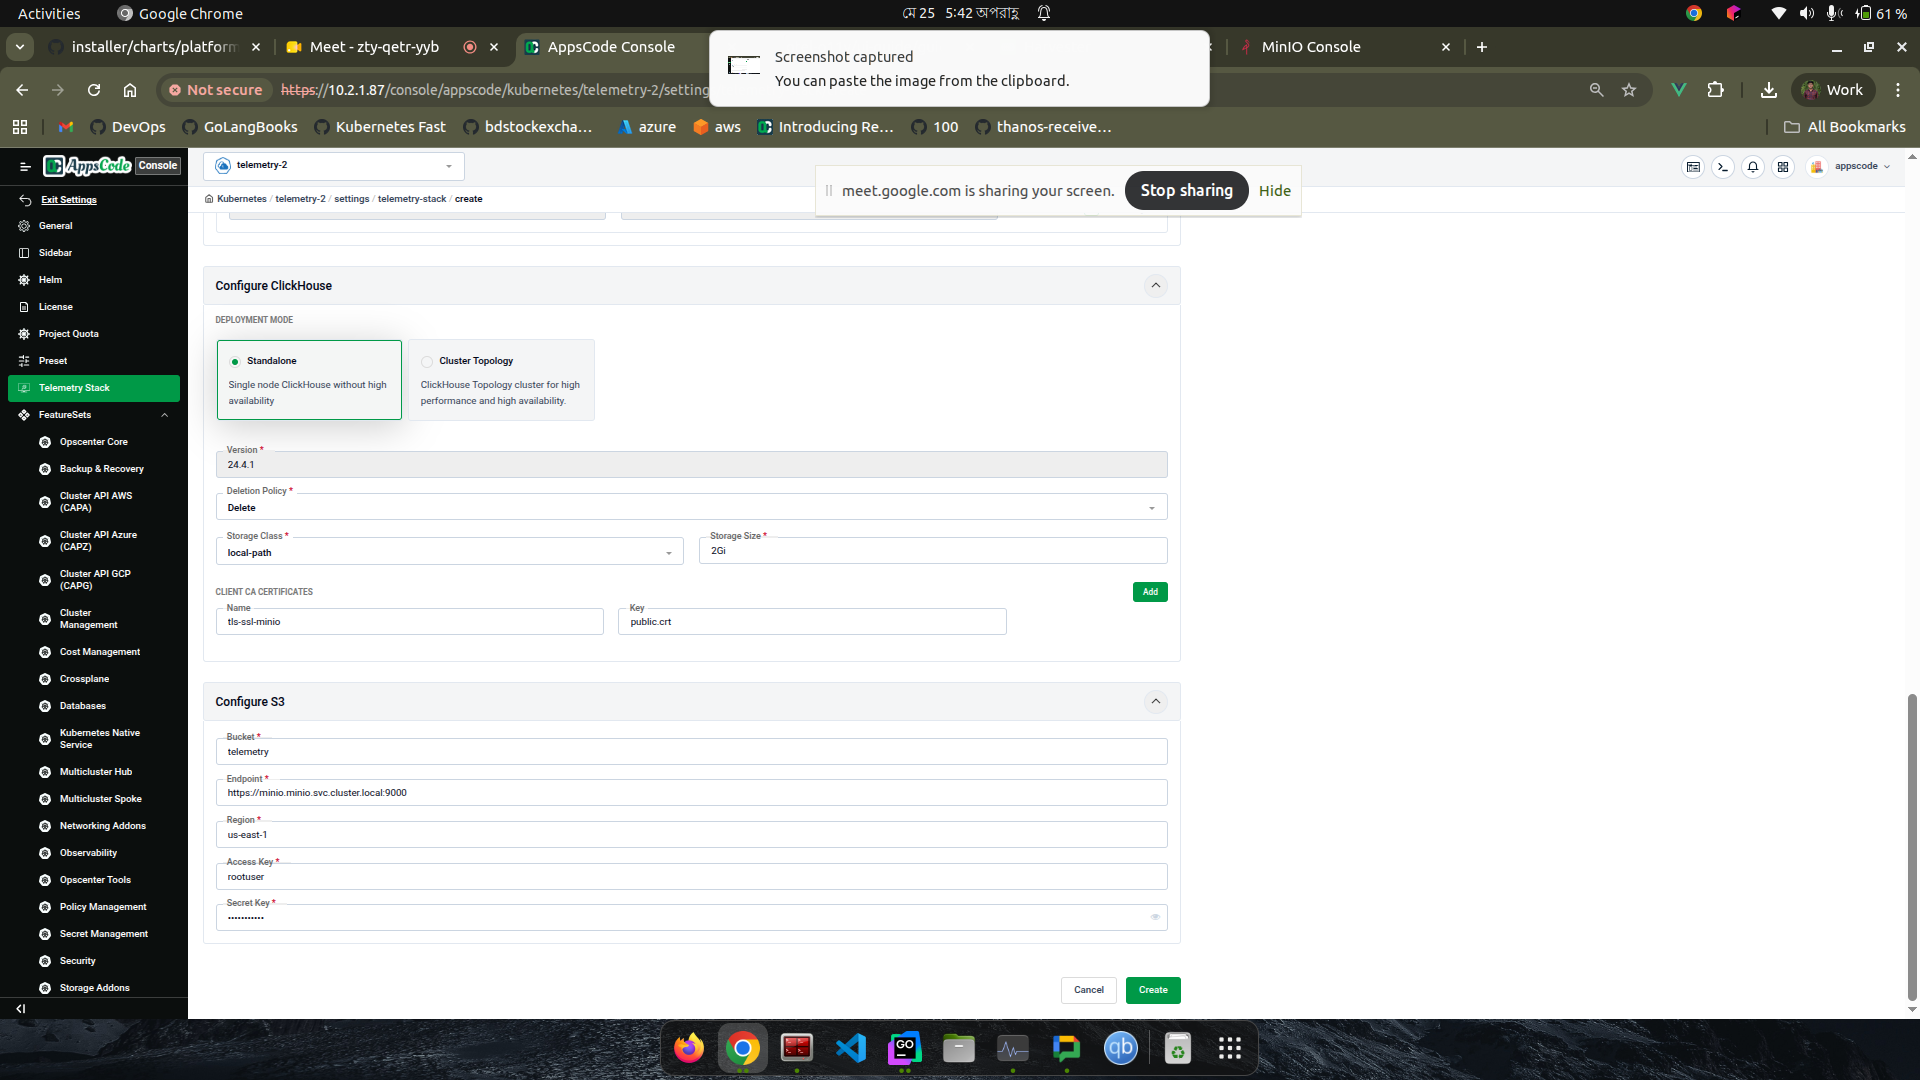
Fill in the configuration sections as shown below.
Configure Metrics (Compact, Store, Query, Router, Ingester):
Ruler, Additional Config, and Configure Clickhouse:
Configure Clickhouse (Standalone / Create Topology), Configure S3, and Configure ID:
Resources Created by the TelemetryStack
Once the TelemetryStack is created, the operators reconcile it into a set of
resources in the monitoring namespace. You can find everything the stack owns
by looking for resources whose owner is the TelemetryStack:
# The Thanos and ClickHouse custom resources generated from the stack
kubectl get thanosreceives,thanosstores,thanosqueries,thanoscompacts,thanosrulers.monitoring.thanos.io,clickhouse -n monitoring

# Any resource owned by the telemetry-stack (children carry it in ownerReferences)
kubectl get all -n monitoring -o json | \
  jq -r '.items[] | select(.metadata.ownerReferences[]?.kind=="TelemetryStack") | "\(.kind)/\(.metadata.name)"'
For the metrics pipeline, thanos-operator produces:
ThanosReceive→ a receive-router deployment plus a receive-ingester StatefulSet — the remote-write ingestion endpoint for incoming metrics.ThanosStore→ a store StatefulSet that serves historical blocks from object storage.ThanosQuery→ query and query-frontend deployments that fan out reads across the receivers and store.ThanosCompact→ one StatefulSet per retention tier that downsamples and compacts blocks in object storage.ThanosRuler→ a ruler StatefulSet that evaluates recording/alerting rules and forwards alerts to Alertmanager.
For the logs / traces pipeline, a KubeDB ClickHouse database
(telemetry-stack-clickhouse) is provisioned, along with the supporting
secrets (telemetry-stack-object-storage,
telemetry-stack-clickhouse-storage-config).
Step 6: Enable OpenTelemetry on a Spoke Cluster
Enable the OpenTelemetry feature on each spoke cluster you want to monitor — either during import or on an existing spoke. See Import Observability Cluster.
Step 7: Create a Client Organization
Create a client organization and point it at the monitoring cluster so its telemetry is stored in the shared TelemetryStack. See Create a Client Organization — the Telemetry Configuration step is where you select the monitoring cluster and set retention.